
Vacancy loss equals scheduled gross income multiplied by your vacancy rate. Alternatively, multiply monthly rent by vacant unit-months, or daily rent by vacant days for shorter gaps. Pick a measurement period first, monthly for active operations or annual for reporting, then match your method to it: scheduled-income math for portfolio-level underwriting, unit-day counting when you need precision on fast turns.
TL;DR:
- Calculating vacancy loss most accurately involves using physical unit-days for quick turnover, especially in fast-moving portfolios.
- Economic vacancy often exceeds physical vacancy due to collections issues, concessions, and rent write-offs, requiring reconciliation with actual income.
- Small operational costs like utilities, marketing, and staff time significantly increase total vacancy-related expenses beyond rent loss alone.
- Shaving a week off unit turn time can dramatically boost property value since vacancy directly impacts effective income and net operating income.
- Real-time turn tracking and vendor coordination help reduce days vacant, but operational discipline is essential to minimize vacancy costs effectively.
Table of Contents
- How Do You Calculate Vacancy Loss?
- What Is the Unit-Day Method for Physical Vacancy?
- What Is Economic Vacancy and Why Does It Exceed Physical Vacancy?
- How Does Vacancy Loss Affect NOI and Property Value?
- How Do You Build a Vacancy Loss Spreadsheet?
- What Hidden Costs Should You Add to Vacancy Loss?
- Should You Use a Calculator or Build Your Own Spreadsheet?
- What Actually Moves the Needle on Days Vacant?
- Reduce Your Vacancy Numbers With Better Turn Coordination
- Where to Verify These Numbers
- Sources
How Do You Calculate Vacancy Loss?
The formula underwriters use most is: Scheduled Gross Income (GSI) × Vacancy Rate = Vacancy Loss. GSI is what every unit would generate if fully leased at market rent for the period. This method works well for pro formas and portfolio-wide comparisons because it treats vacancy as a single percentage applied against total revenue potential. The approach described by Wall Street Prep uses it in its standard vacancy loss model.
Smaller operators often skip the percentage math entirely and go straight to dollars:
- Unit-month shortcut: empty units × monthly rent × months vacant. Good for a quick gut check on a ten-unit building.
- Daily-rate conversion: (monthly rent ÷ 30) × days vacant. Better than month-counting when a unit sits empty for 12 days, not a full cycle.
- Annual roll-up: sum monthly losses across 12 months when you need a number for tax filings or investor reports.
Match your reporting period to your accounting calendar. If your books close monthly, calculate vacancy loss monthly and let it roll up. Switching periods mid-year makes trend comparisons meaningless.
What Is the Unit-Day Method for Physical Vacancy?
Physical vacancy measures actual empty units against total available inventory over a period, and unit-days give you the precision that month-counting misses.
- Calculate available unit-days: total units × days in the period.
- Calculate vacant unit-days: sum of days each unit sat empty.
- Divide vacant unit-days by available unit-days for the physical vacancy rate.
- Multiply that rate by total potential rent to get the dollar loss.
A 10-unit building over a 30-day month has 300 available unit-days. At $1,200 average rent per unit, monthly potential rent is $12,000, so the dollar loss is $1,800. This method, detailed in LegalClarity's breakdown of vacancy loss formulas, beats simple month-counting whenever you have partial-month move-outs or high turnover, which is most fast-turn portfolios.
What Is Economic Vacancy and Why Does It Exceed Physical Vacancy?
Economic vacancy captures revenue you lost to more than just empty units. It includes bad debt, concessions, non-revenue units (models, employee units), and rent write-offs.
The formula: Gross Potential Rent − Rent Collected = Economic Vacancy Loss, with the rate calculated as that loss divided by gross potential rent.
To compute this reliably, reconcile your rent roll against actual deposit and collections records, not against what leases say tenants owe. The gap between those two numbers is where economic vacancy hides.
- Pull gross potential rent from the rent roll for the period.
- Pull actual collections from bank deposits or your accounting system.
- Subtract concessions and write-offs separately so you can see which is driving the gap.
Pro Tip: If economic vacancy runs meaningfully higher than physical vacancy, the problem usually isn't the market, it's collections or concession policy. Check those before you touch pricing.
How Does Vacancy Loss Affect NOI and Property Value?
Vacancy loss flows through an income waterfall that ends at your property's valuation. Potential Gross Income minus vacancy and credit loss gives you Effective Gross Income (EGI), the figure Corporate Finance Institute defines as the revenue base for every downstream calculation. Subtract operating expenses from EGI and you get Net Operating Income (NOI). Divide NOI by your market cap rate and you get value.
At a typical cap rate, every $1,000 in annual vacancy loss significantly reduces a property's appraised value, magnified by the cap rate used. This is why shaving a week off turn time matters more to ownership than almost any other single metric.
That multiplier is why a service manager shaving a week off turn time matters more to ownership than almost any other single metric. Loss-of-rents insurance can offset some of this, but coverage typically caps at a set number of months and usually excludes vacancy caused by normal turnover or make-ready delays, only casualty-related vacancy.
How Do You Build a Vacancy Loss Spreadsheet?
- Pull scheduled gross income from your rent roll or a current market rent survey.
- Choose your period, monthly for tracking, annual for reporting.
- Compute physical vacancy using unit-days, and economic vacancy from the collections gap.
- Convert both to dollars and total them for the full picture.
For a single unit: daily rate ($1,200 ÷ 30 = $40) × 18 days vacant = $720 lost. Calculate loss per unit and loss per occupied unit separately, the second number tells you what your remaining residents are effectively subsidizing.
Your spreadsheet template needs these columns at minimum:
- Reporting period
- Total unit-days and vacant unit-days
- Scheduled rent vs. rent collected
- Make-ready cost per turn
Keep raw data in one tab and formulas in another so you can audit the math later without rebuilding it.
What Hidden Costs Should You Add to Vacancy Loss?
Rent you didn't collect is only part of the bill. Utilities on vacant units, marketing spend, leasing commissions, cleaning, repairs, and carpet replacement all stack on top. So does staff time coordinating vendors and walking units, and any ancillary income (parking, pet fees, storage) you lose along with the lease.
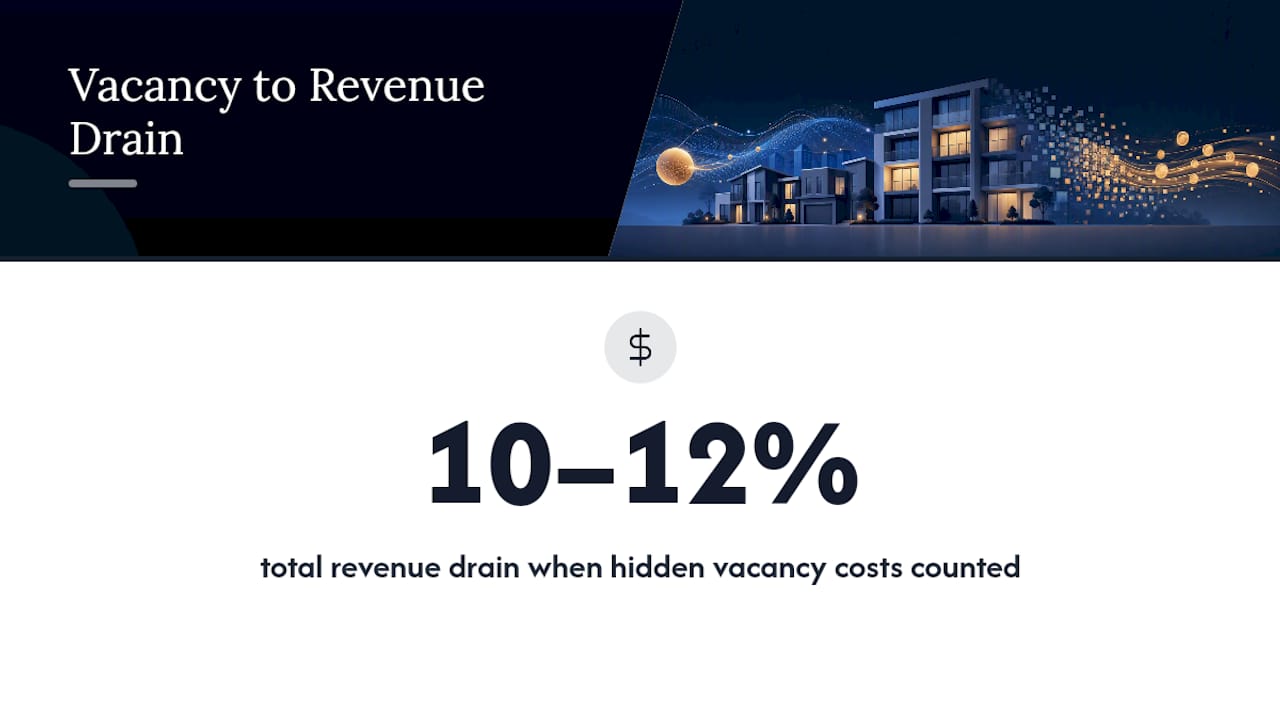
Make-ready costs commonly run $1,000 to $4,000 per unit depending on scope, and Wall Street Prep's analysis notes these carrying costs regularly push a stated 7% physical vacancy figure into a 10% to 12% total revenue drain once everything is counted.
Pro Tip: Batch your make-ready work, painters and flooring crews on the same day, and negotiate flat-rate vendor agreements instead of per-visit pricing. Both cut the hidden costs faster than any pricing change.
Should You Use a Calculator or Build Your Own Spreadsheet?
Simple calculators handle the GSI × vacancy rate formula fine for a quick estimate. Advanced tools go further, taking gross potential rent, actual rent collected, total units, and occupied units to report physical and economic vacancy side by side, the two-mode structure MyTimeCalculator's vacancy loss tool offers.
Whichever you use, track these fields consistently:
- Scheduled gross income and actual rent collected
- Total units, occupied units, and vacant unit-days
- Make-ready costs and turn timelines per unit
Check your internal vacancy rate against Census HVS benchmarks periodically. If your number runs far above the local average, the issue is likely operational, not market demand. Export raw numbers to a spreadsheet regardless of which calculator you use, auditability matters when an owner questions your figures.
What Actually Moves the Needle on Days Vacant?
Formulas tell you how much vacancy costs. They don't fix it. What shortens days vacant is boring operational discipline: vendor coordination that lives inside the turn instead of scattered across texts, clear property standards so nobody's guessing on paint color or filter size, and a timeline status everyone can see before a unit slips from On Track to At Risk.
Track vacant unit-days, average make-ready days, and your backlog of at-risk turns weekly. Those three numbers surface drift before it shows up in a financial report a month later, which is usually too late to do anything about it.
— TurnTrack Team
Reduce Your Vacancy Numbers With Better Turn Coordination
The math in this article tells you what vacancy costs. TurnTrack is built to shrink the number that goes into that formula. Every turn gets a shared status (Ready, On Track, At Risk, Overdue) and a timeline from move-out through make-ready, so a slipping turn shows up before it becomes a missed lease date.

Vendor coordination lives inside each turn, no digging through a separate contact list when you need the carpet crew. The Property Standards Library keeps specs like paint sheen and filter size in one place, shareable with a tech or vendor who never needs a TurnTrack account. Photo proof is there when a property requires documentation, not forced onto every task.
TurnTrack is not a property management system, it doesn't touch rent, leases, or tenant communication. It manages the turn itself. The subscription is workspace-level at $14.99 a month, with a free trial, available on iOS through the App Store. Start your free trial and see what tracking your turns in one place does to your average vacant days.

Where to Verify These Numbers
Cross-check your vacancy assumptions against Census HVS data, the authoritative national benchmark for rental vacancy rates, updated regularly and used by housing economists to gauge market conditions. For the underlying formulas covered here, Wall Street Prep's vacancy loss guide and Corporate Finance Institute's EGI breakdown hold up as reference points. Revisit your local vacancy assumption every quarter, markets shift faster than most rent rolls get updated.
Sources
- Effective gross income (EGI) definition — Corporate Finance Institute
- Housing Vacancies and Homeownership (HVS) — U.S. Census Bureau
- Vacancy Loss | Formula + Calculator — Wall Street Prep
- How to calculate vacancy loss: formula and tax treatment — LegalClarity
- Vacancy Loss Calculator — MyTimeCalculator